

In this edition of Moves and Moods, we look at the copper market.
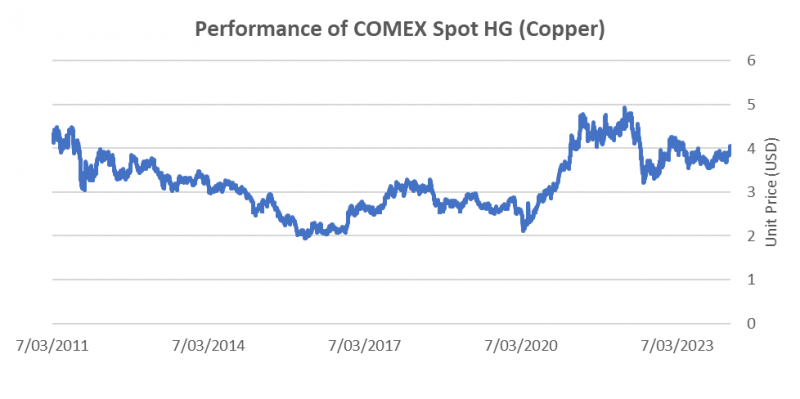
There was a sharp upward move last week due to rumours that Chinese refiners would move to reduce output, Figure 1.
When viewed over the past 10 years, this barely registers. However, the market seems primed to consider a change of tone from a well-supplied market, to a period of supply disruption.
The First Quantum (TSE:FM) Cobre Panamá mine had to close due to an adverse Supreme Court ruling, against a backdrop of protests over environmental damage.
The market is also concerned about power restrictions in Zambia, which may reduce copper output from energy intensive smelters.
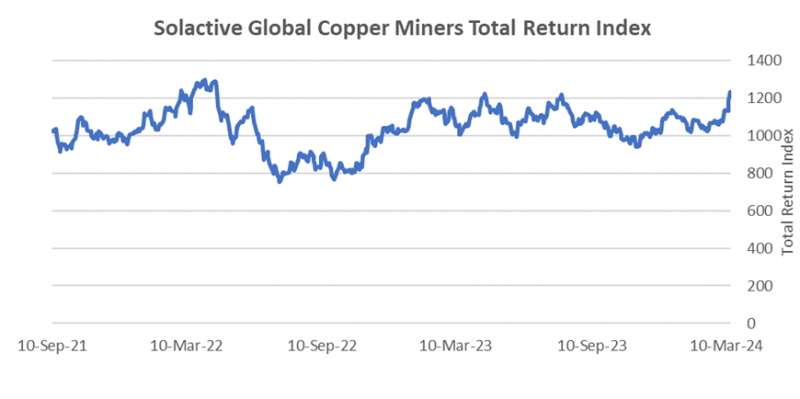
The stock performance was decidedly more positive than the metal, Figure 2. A diversified index of around 40 global copper miners, with weightings adjusted to emphasize copper exposure, has rallied sharply since the start of the year.
Investment Opportunity
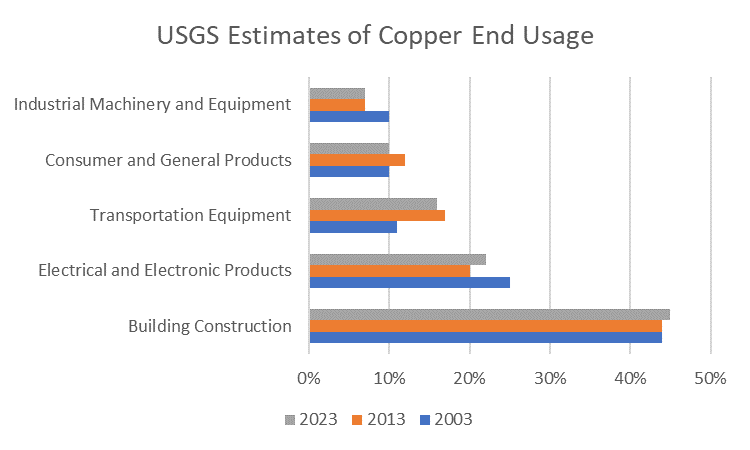
Copper is the premier economically sensitive metal. While there is an obvious role for copper in electrification, it plays a larger role in building construction, Figure 3. This is due to the use of copper pipes and fixtures in gas fittings, appliances, plumbing, and wiring. The metal has been central to industrialization since ancient times. The Bronze Age preceded the Iron Age.
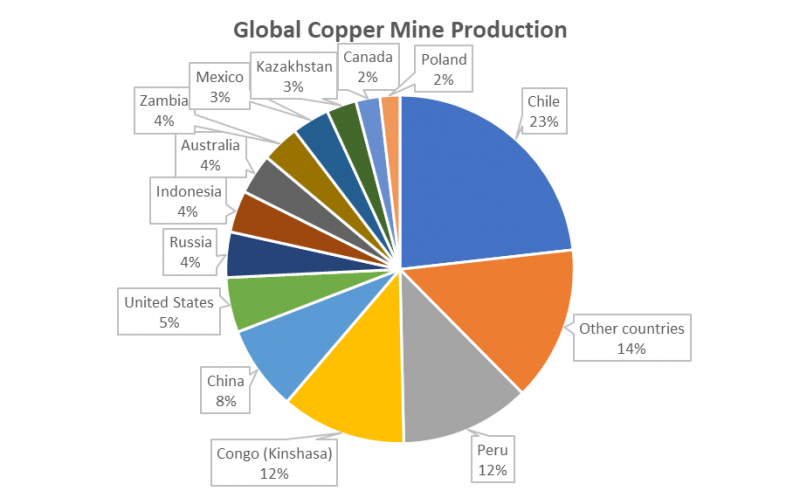
The other factor which seems to change slowly is where the copper comes from, Figure 4. Latin America, and North America are rich in copper, due to the geological activity all along the mountain range known as the Spine of the Americas. The combination of colliding continental plates and volcanism, provides perfect conditions for laying down copper and copper-gold deposits.
Earlier we mentioned building construction as the key end use for copper. For decades, this has been the case, with the figure accounting for 40-50 per cent of usage. Scrap is a key secondary source of copper. Smelting and refining operations are key to the global copper market, both for conversion of ores to metallic copper, and recycling. The market for this activity is dominate by China, Figure 5.
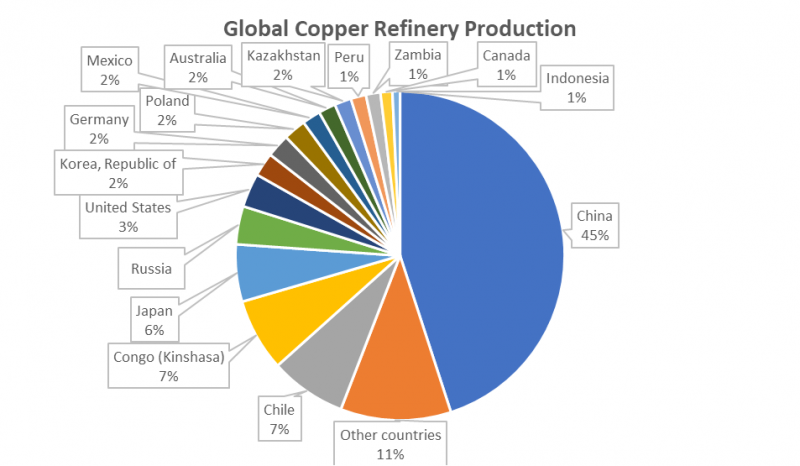
One should note that the US is a significant producer of copper and retains significant smelting and refining capacity. The key import stocks for USA come from Mexico and Canada, in addition to its own significant mining operations. While Japan has next to no mining, it is big in refining. India does not show up in these activity charts, even though it has some mining and smelting operations – but there are not large copper reserves in India. We may see growth in refining there to meet domestic demand, which is rising due to the rapid build out of infrastructure to support industrialisation.
Move for This Mood
The big dog in the midstream copper market remains China.
Construction activity has been depressed due to the real estate crisis, but electric vehicles, industrial automation, motor needs, electrical machinery and power transmission are rising.
The profit margins for Chinese smelters have been razor thin and they dominate the global market. Recent speculation suggests that this pain may have gone too far, and there are moves to reduce supply.
Due to the significant role that China plays in the midstream, this should be bullish for copper prices.
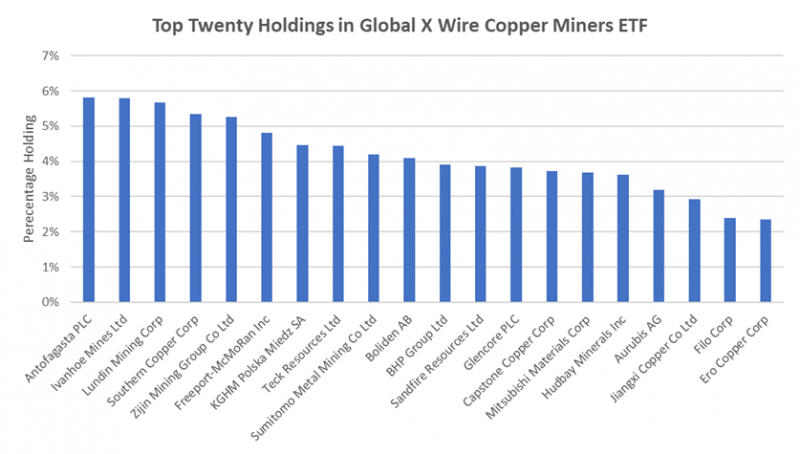
It can be difficult to get exposure to the global copper market with ASX-listed shares. There is an ETF product, the Global X Copper Miners ETF (ASX: WIRE), which provides diversified exposure to a range of global copper mining, trading and refining operations, Figure 6. Note that the fee is 0.65 per cent and the product uses a modified market capitalisation weighting scheme. This means that BHP Group (ASX: BHP) has reduced weight in the ETF, due to its iron ore operations. Rio Tinto Ltd (ASX: RIO) does not appear at all. This is due to copper contributing less than 10 per cent of group revenues. However, these funds provide a useful starting point for self-directed investors who want to survey global opportunities.
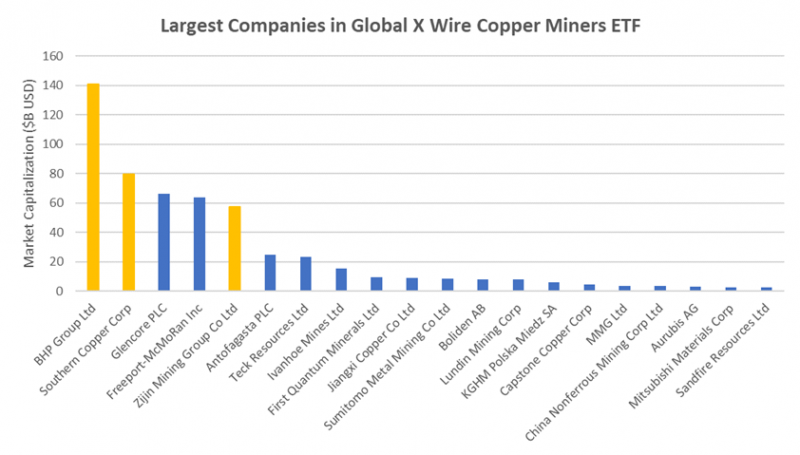
The rank by market capitalization looks different, Figure 7. My preferred stocks appear in gold.
BHP Group has the largest copper reserves globally, and significant operations in Chile, and at the Olympic Dam site.
Southern Copper (NYSE: SCCO) is based in the US, but has its major operations in Mexico and Peru. These mines have significant molybdenum by-product credits along with silver and other base metals. During times of decent prices, it spins off cash and dividends, but retains solid prospective growth.
Finally, I have chosen China-based Zijin Mining Group (HKG: 2899). Zijin has a solid growth profile in both copper and gold and has developed new high-grade resources in Africa.
Copper is showing signs of life, and we think that the long-term outlook is positive due to the difficulty of finding large new copper deposits. Poor margins in smelting indicate overcapacity in that area, but due to the dominance of China, smelter output reductions ought to firm prices quickly.
In my view, this is a suitable time to look at quality copper producers. There are risks, due to the heavy role of copper in construction activity, but the tailwind from electrification is supporting good exploration projects. If the copper price holds above US$4 a pound, bullish sentiment will grow.
Disclosure: the author holds shares in BHP Group, Rio Ltd, Southern Copper and Zijin Mining Group. The author also holds shares in Sumitomo Corporation, Mitsubishi Corporation and Mitsui Corporation which have interests in companies mentioned.
Disclaimer:This article contains information and educational content provided byJevons Global Pty Ltd, a Corporate Authorised Representative (AR1250727) of BR Securities Australia Pty Ltd (ABN 92 168 734 530) which holds an Australian Financial Services License (AFSL 456663). The Market Online does not operate under a financial services licence and relies on the exemption available under section 911A(2)(eb) of the Corporations Act 2001 (Cth) in respect of any advice given.
The information is intended to be general in nature and is not personal financial advice. It does not take into account your personal financial situation or objectives and you should consider consulting a qualified financial professional before making any investment decision. All brands and trademarks included in this report remain the property of their owners.
The material provided in this article is for information only and should not be treated as investment advice. Viewers are encouraged to conduct their own research and consult with a certified financial advisor before making any investment decisions. For full disclaimer information, please click here.